I recently read an interesting article about about the concept of “openers.” The article shared the idea of having a reliever pitch the first inning of a game. An “opener” is based on two concepts: 1) starters get progressively worse as they face a lineup repeated times, and 2) relief pitchers tend to thrive in dedicated roles.
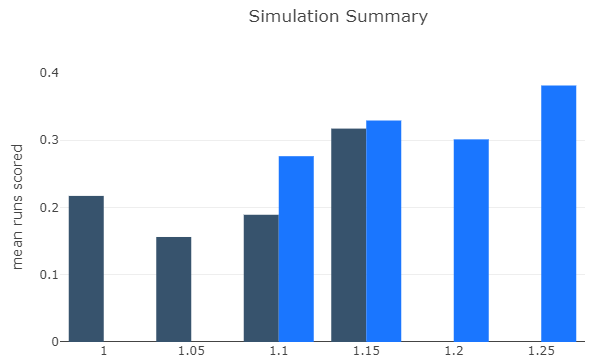
How can teams explore the potential impact of such a strategy? One idea is to use a multi-armed bandit, an approach that balances exploration and exploitation. Below is an app I built that runs a multi-armed bandit based on the inputted exploration value. Exploration represents how often something new is tried, such as using an opener or leveraging a closer before the ninth inning. Exploitation represents how frequently the tried-and-true methodology is used.
Specifically, the app below establishes a multi-armed bandit framework for analyzing what could happen when using a closer in situations other than the ninth inning. The numbers used in the simulation are based loosely on reality. My interest was mainly in developing the technical framework rather than tracking down specific numbers. That being said, do not read much into these results.
To use the app, enter an exploration percentage using the drop down menu. Clicking submit will kick off a simulation of 1,000 different scenarios. The “leverage” metric represents how important the situation is (shown on the x-axis in the graph). The highest leverage situations will be found when exploring – using the closer in the most important situations in the game (e.g. bases loaded with one out in a tie game in the seventh inning). Likewise, low-leverage situations will only be found when exploiting (e.g. up three runs in the ninth)
Again, my focus was mostly on developing the framework, not tracking down the specific numbers that should go into the simulation.
The app below may take a few seconds to load. Also, of note, the simulation takes a couple of seconds to run, so be patient

