Welcome to baseballdatascience.com! This site combines two of my passions: baseball and data science. I look forward to (hopefully) bringing you fresh, quantitative-based viewpoints on America’s pastime.
This first blog analyzes Statcast data from baseballsavant.com, which essentially tracks every player’s movement during every game. The amount of detail these datasets provide is truly impressive. Specifically, this first post analyzes All-Star Game MVP Eric Hosmer’s Statcast data. The code (written in R) and data for this analysis can be found on my GitHub page.
Initial Exploration
I began the analysis by using ggplot to better understand the results of balls hit in play and types of pitches hit in play. (See the Statcast Search feature for the type of pitch that corresponds to each acronym. Most are fairly self-explanatory).
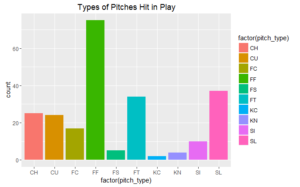
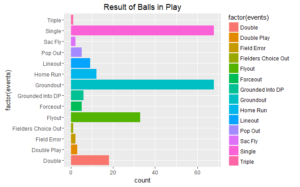
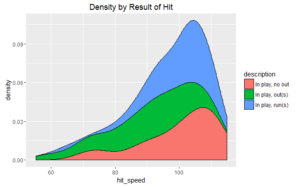
OK, nothing too surprising here. Hosmer most often puts in play common types of pitches (four-seam fastballs and sliders), and singles and groundouts are the most common results of balls hit in play. Based on the density chart, we can also see that Hosmer’s hit speed spikes at slightly more than 100 MPH, and increased speed corresponds to hits that drive in runs or that do not result in outs.
Location of Balls Put in Play
Statcast also shows us where the balls were hit. Hosmer is anecdotally known for spraying the ball to all fields, but I wanted to investigate if his hit location is dependent on pitch type. For example, does Hosmer tend to pull off-speed pitches and take fastballs the other way? A chi-squared test can help us answer this question.
Interestingly, the p-value for the test is 0.87, falling well short of statistical significance. Therefore, we do not have enough evidence to assert that hit location is dependent on pitch type. ( In retrospect, a better test might involve aggregating the data into fewer hit locations and pitch types).
Analysis of Hit Distance, Angle, and Speed
For every ball put in play, Statcast tells us the hit’s distance, angle, and speed. Looking at Hosmer’s data, we can uncover a few interesting data points. (Note, some of these sample sizes are low, and results should be viewed as directional rather than statistically significant).
- Hosmer hits sinkers and change-ups the furthest, with mean distances of 248 and 228 feet, respectively.
- Hosmer hits sinkers and split-finger fastballs with the most velocity off the bat (each having a mean speed of 101 MPH).
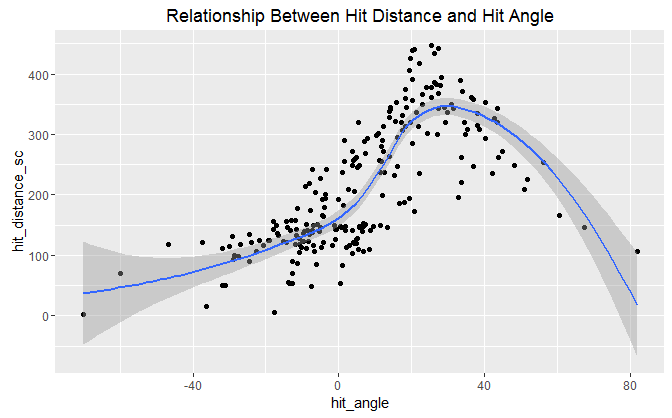
Inspecting the relationship between hit distance, angle, and speed could also be insightful. Let’s take a look at scatter plots with lowess lines plotted through them.
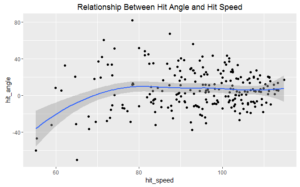
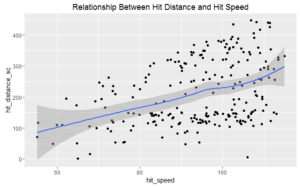
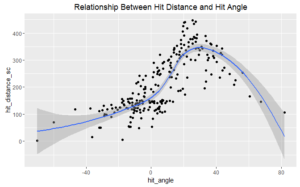
OK, nothing too surprising here. The relationship between hit angle and hit speed is relatively flat (you can smack ground balls as well as pop flies). There’s a pretty decent linear relationship between hit distance and hit speed, which makes intuitive sense. However, what’s interesting is the relationship between hit distance and hit angle. The lowess line follows a somewhat exponential trend until a distance of ~350 feet and an angle of ~30 degrees, and then the relationship turns negative. Upon investigation, this inflection point is when Hosmer’s batted balls turn into fly outs, rather than a mix of pop outs, home runs, and extra-base hits.
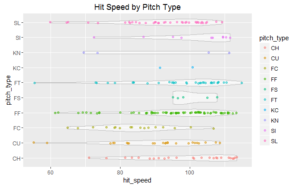
Related, we can use a violin plot to inspect if Hosmer hits certain types of pitches with greater velocity. Most distributions are fairly uniform.
Hit Speed by Pitch Break
One of the amazing items about Statcast data is the detailed information about the pitches hitters face. One of my favorite metrics is the pitch’s break length. I subsetted the dataset by quartile of break length and looked at Hosmer’s hit speed in each bucket. (In this instance, quartile four corresponds to pitches with the greatest break).
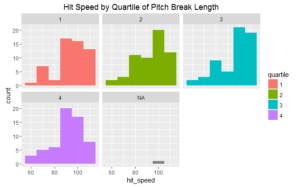
Not surprisingly, the distribution of hit speed on pitches with the least break skews to higher velocities. Interestingly, a greater proportion of pitches in the third quartile were hit more than ~100 MPH compared to pitches in the second quartile. Lastly, and of no shock, pitches with the largest break (quartile four) had the lowest proportion of hits with velocity greater than 100 MPH.
Impact of the Count
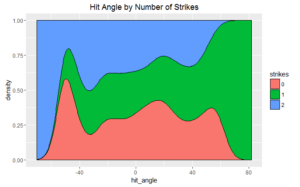
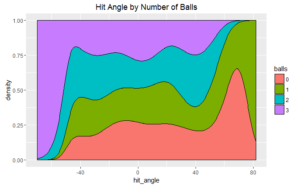
I also investigated the impact of the count on Hosmer’s hit speed, distance, and angle. Interestingly, for Hosmer, the number of balls and strikes seems to have little impact on hit speed and distance. However, the patterns for hit angle are quite intriguing. For example, Hosmer’s hit angle tends to be greater when he has one strike, which mostly corresponds to pop outs, home runs, and extra base hits. Additionally, Hosmer has a spike in launch angle at ~70 degrees when he has no balls, and when he puts something in play with three balls, the launch angle is more likely to be negative (which means the hit is likely either a single or a groundout).
K-Means Cluster of Hits
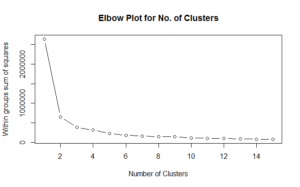
Finally, I used a k-means algorithm to cluster Hosmer’s hits based on distance, speed, and angle. Looking at the elbow plot, there is a pretty clear “elbow” at two clusters. However, to make things more interesting, I’ll run the algorithm using three clusters.
Using principal components analysis, we can “shrink” our data into a two-dimensional space and visualize our three-cluster solution.
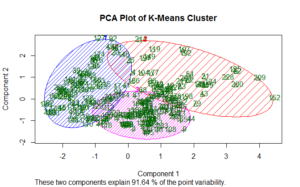
The following bullets describe Hosmer’s three “segments” of hits, as defined by the foregoing algorithm.
- Cluster 1: 91 balls in play, the “power” cluster. This cluster corresponds to balls hit with the longest distance, highest speed, and greatest positive angle. Overall, this cluster included 33 flyouts, 19 singles, 14 doubles, and 12 home runs.
- Cluster 2: 56 balls in play, the “weakly-hit groundballs” cluster. This cluster corresponds to balls hit with the least distance, slowest speed, and smallest angle. In sum, this cluster included 33 groundouts and 13 singles.
- Cluster 3: 86 balls in play, the “sharply-hit groundballs” cluster. This cluster corresponds to balls hit with moderate distance, speed, and angle. Overall, this cluster included 36 singles and 35 groundouts.
And…that’s a wrap! Clearly, Statcast data is unbelievably detailed, and coupled with the power of R, some informative analysis can be conducted.
Thank you for reading, and I look forward to bringing you more analysis in the coming weeks!
