The shift is a major tactical tool in baseball, one that has gained substantial attention recently due to its increased use. Some teams shift a lot, like the Astros, who employ a shift on 37% of all plays. The Angels shift the least of any team, at only 3% of all plays. Likewise, some players are “shifted on” more than others. For example, Chris Davis is shifted on in more than 90% of plate appearances!
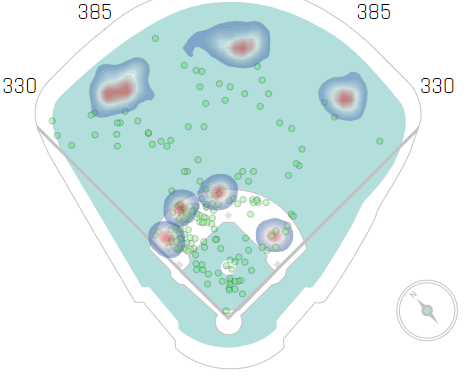
Shift data is available at: https://baseballsavant.mlb.com/visuals/batter-positioning. This includes some raw data as well as heatmaps depicting shifts. The below is the visual summary for how teams shift Giancarlo Stanton.

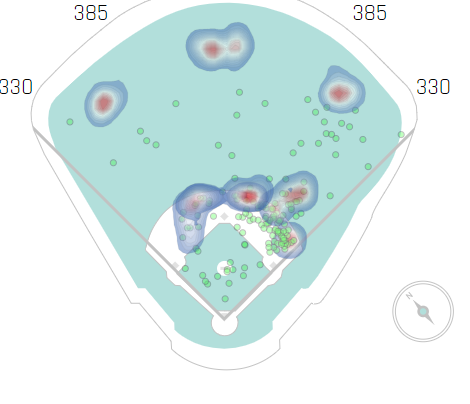
And here is how teams shift Bryce Harper.

Can a deep learning algorithm, specifically a convolutional neural net, predict which type of hitter is at the plate given a shift image? We’ll give it a shot and see what happens.
I downloaded a few dozen shift images and placed them into four classes, defining the type of hitter: left average, left power, right average, and right power. I trained on 38 images, used 14 images for validation during training, and tested on 10 images.
As a baseline, I trained a shallow neural network with only one hidden layer. On the validation data, the model performed just a little bit better than random. Not too surprising.
I subsequently used the framework from the VGG16 model, a popular convolutional neural network architecture, which has more than 138 MM parameters (see structure below). The model achieved 55% accuracy on the validation set during training.
_________________________________________________________________
Layer (type)                 Output Shape              Param #
=================================================================
input_1 (InputLayer)         (None, 224, 224, 3)       0
_________________________________________________________________
block1_conv1 (Conv2D)        (None, 224, 224, 64)      1792
_________________________________________________________________
block1_conv2 (Conv2D)        (None, 224, 224, 64)      36928
_________________________________________________________________
block1_pool (MaxPooling2D)   (None, 112, 112, 64)      0
_________________________________________________________________
block2_conv1 (Conv2D)        (None, 112, 112, 128)     73856
_________________________________________________________________
block2_conv2 (Conv2D)        (None, 112, 112, 128)     147584
_________________________________________________________________
block2_pool (MaxPooling2D)   (None, 56, 56, 128)       0
_________________________________________________________________
block3_conv1 (Conv2D)        (None, 56, 56, 256)       295168
_________________________________________________________________
block3_conv2 (Conv2D)        (None, 56, 56, 256)       590080
_________________________________________________________________
block3_conv3 (Conv2D)        (None, 56, 56, 256)       590080
_________________________________________________________________
block3_pool (MaxPooling2D)   (None, 28, 28, 256)       0
_________________________________________________________________
block4_conv1 (Conv2D)        (None, 28, 28, 512)       1180160
_________________________________________________________________
block4_conv2 (Conv2D)        (None, 28, 28, 512)       2359808
_________________________________________________________________
block4_conv3 (Conv2D)        (None, 28, 28, 512)       2359808
_________________________________________________________________
block4_pool (MaxPooling2D)   (None, 14, 14, 512)       0
_________________________________________________________________
block5_conv1 (Conv2D)        (None, 14, 14, 512)       2359808
_________________________________________________________________
block5_conv2 (Conv2D)        (None, 14, 14, 512)       2359808
_________________________________________________________________
block5_conv3 (Conv2D)        (None, 14, 14, 512)       2359808
_________________________________________________________________
block5_pool (MaxPooling2D)   (None, 7, 7, 512)         0
_________________________________________________________________
flatten (Flatten)            (None, 25088)             0
_________________________________________________________________
fc1 (Dense)                  (None, 4096)              102764544
_________________________________________________________________
fc2 (Dense)                  (None, 4096)              16781312
_________________________________________________________________
predictions (Dense)          (None, 1000)              4097000
=================================================================
Total params: 138,357,544
Trainable params: 138,357,544
Non-trainable params: 0
_________________________________________________________________
Though the model achieves about the same accuracy on the test set as it did on the validation data, it is not too confident about the predictions. The array below shows the predicted probabilities for each class (left average, left power, right average, and right power).
array([[0.2556149 , 0.24454796, 0.25286797, 0.24696916],
       [0.2587511 , 0.25009993, 0.24707112, 0.24407783],
       [0.25480285, 0.25288925, 0.24500874, 0.24729916],
       [0.2539842 , 0.24766006, 0.24739222, 0.2509635 ],
       [0.2564557 , 0.24980268, 0.24455391, 0.24918771],
       [0.25047612, 0.2562532 , 0.24672817, 0.2465425 ],
       [0.24376307, 0.25421596, 0.2458072 , 0.25621375],
       [0.24046981, 0.25654346, 0.25302368, 0.24996305],
       [0.25108308, 0.2502494 , 0.24681565, 0.2518519 ],
       [0.25356355, 0.25640205, 0.24492882, 0.2451056 ]], dtype=float32)
Why might the model be under-performing? Part of me wonders if it’s due to the image including the placement of all a batter’s hits (the green dots). This likely does add some noise to the image. I also could train on more data; the training set was only 38 images.
I think this is a promising and interesting area where I’d like to do more work. One of the big steps will be cleaning up the images a bit. Exciting work ahead!
