No question about it, the Cubs have had an impressive season. One of the reasons for their success, of course, is strong starting pitching, with Jake Arrieta leading the way. In this blog, I analyze Arrieta’s no-hitter from April 21 against the Reds.
The analysis, coded in R, can be found on my GitHub account.
Data Ingestion
I began by creating a simple web scraper to extract Arreita’s Pitchf x data for the game from brooksbaseball.net. This data is incredibly rich, providing per-pitch metrics on items like velocity, spin, location, movement, and each play’s outcome. By running a summary of the data, we see that Arreita threw 119 pitches in the game, with 55 of those being his sinker. We can also find other interesting data points, like there were 17 foul balls, and the mean start speed of his pitches was 92.12 MPH (start speed is a slightly different metric of velocity).
Inspecting Arreita’s Pitches
I then pivoted to looking at Arreita’s pitch speed, movement, and spin.
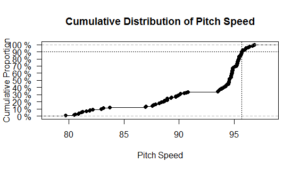
By looking at the cumulative distribution of pitch speed, we can see a cluster of pitches between approximately 81-83 MPH, another cluster between approximately 87-91 MPH, and a final concentration between approximately 93-97 MPH.
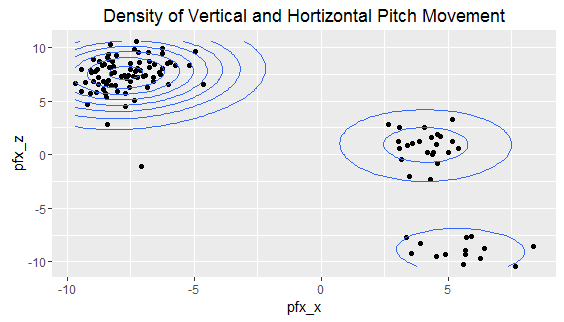
Next, I looked at horizontal and vertical pitch movement. pfx_z corresponds to vertical movement, while pfx_x relates to horizontal movement. (The measurement of pitch movement is tricky and, in my opinion, not strongly intuitive, although it is useful. This glossary – which is somewhat dated but still appears to be accurate – provides an explanation of how these metrics are measured, and this GitHub page also provides useful information on pitch movement). Interestingly, the chart below shows three clusters of pitches. The majority of pitches have high vertical movement and low horizontal movement, which corresponds to Arrieta’s sinkers and fastballs. Another cluster of pitches often hovers slightly above zero in vertical movement and between 2.5-5 in horizontal movement; these are mostly sliders. The last clustering of pitches has negative vertical movement and horizontal movement hovering around 5, which mostly corresponds to curve balls.
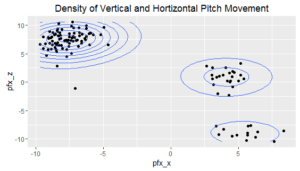
To underscore this point, I created a scatter plot of vertical and horizontal movement and faceted it by pitch type.
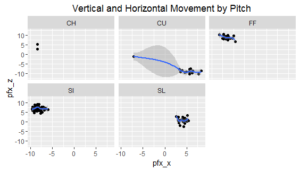
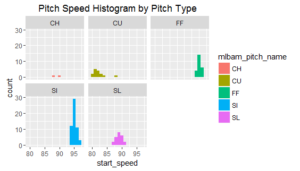
Subsequently, I investigated pitch speed by type of pitch. We see that fastballs and sliders hover around 95 MPH, while sliders are between 85-90 MPH and curve balls hover around 80 MPH.
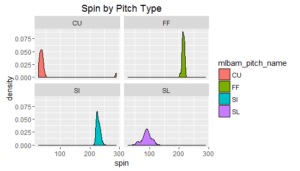
Lastly, I looked at spin by type of pitch. (Note, I could not find any solid documentation on the scale of the spin variable; I think it is an angle, but I certainly could be mistaken).
Performance in Different Scenarios
My next segment of analysis involved looking at Arrieta’s performance at different points in the game. Breaking the game into early, middle, and late segments (each three innings), we see some interesting items.
- Arrieta threw a higher proportion of sliders in the first three innings (22.4% of pitches compared to 19.4% in the middle innings and 14.7% in the late innings)
- He also threw slightly more curves balls in the first three innings (14.3% of pitches compared to 11.1% in the middle innings and 11.8% in the late innings)
- He was most reliant on his sinker in the middle innings (50% of pitches compared to 42.9% in the early innings and 47.1% in the late innings)
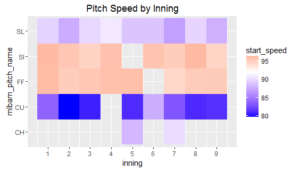
On average, we also see that Arrieta had the highest pitch speed in the middle innings (92.5 MPH). Seeing this, I wanted to dig a little deeper and uncover any interesting patterns, so I created a heat map that shows Arreita’s pitch speed by type of pitch for each inning. Most interestingly, we find that Arrieta’s fastball had the greatest velocity in the first and eighth innings, and his sinker also had the greatest velocity in those innings!
Predicting Arrieta’s Next Pitch Using Decision Trees and Random Forest
As the final part of this analysis, I wanted to see if I could use machine learning to predict Arrieta’s next pitch based on the results of the previous play and current conditions. I created a predictive model that would attempt to predict if Arreita’s next pitch would be offspeed (change-up, curve ball, slider) or fast (sinker, fastball) using the following independent variables:
- If the previous pitch was a ball or strike; this is indicative of whether a pitch was in or out of the strike zone, not necessarily if it was called a ball or strike (ball_strike variable)
- If the previous pitch was offspeed or fast (pitch_lag)
- If the previous pitch was thrown on the left, right, or middle of the plate (location)
- If the previous pitch was put in play or not put in play (previous_result)
- If the current hitter is right or left handed (hitter_stance)
- The current number of strikes (strikes)
- The current number of balls (balls)
- If we are early or late in the game (inning)
Using Excel, I slightly modified the original data to represent the foregoing variables. I realize that 1) we are working with a small data set, and 2) this model misses many nuances, like how hard the previous pitch was hit. (I plan to build out more rigorous prediction models in future blogs).
After splitting the data into training and tests sets, I ran a decision tree on the data. Below is a print out of the tree.
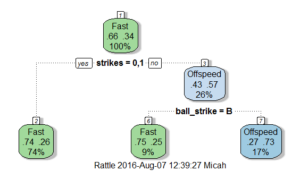
Interestingly, the tree only uses two variables from the model: the current number of strikes and if the previous pitch was a ball or strike. If the batter has 0 or 1 strikes, we assign a probability of 74% to the upcoming pitch being “fast.” If the hitter does not have 0 or 1 strikes, meaning they have two strikes, we assign a probability of 75% to the next being being “fast” if the previous pitch was a ball. Likewise, if the hitter does not have 0 or 1 strikes, meaning they have two strikes, we assign a probability of 73% to the next being being “offspeed” if the previous pitch was a strike. (Again, balls and strikes refer to if the pitch was in or out of the zone, not necessarily if the pitch was called a ball or strike).
This fitted model seems to be missing quite a bit of nuance, and I expect it to perform poorly when predicting on our test dataset. (Note, if we ran this model again, the algorithm might draw different decision boundaries, and the tree could look slightly different).
And this is exactly the case. On the test dataset, our model only had an accuracy of 55.17%! On our test set of 29 variables, we correctly predicted 15 fastballs and only 1 offspeed pitch. There were 9 instances when we said the pitch would be fast when, in fact, it was an offspeed pitch. Additionally, there were four cases when we predicted offspeed when the pitch was fast.
I then tried a random forest, which utilizes multiple decision trees and normally performs better than a single tree.
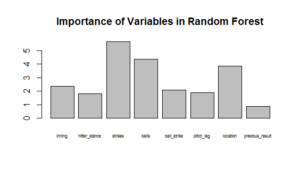
In this case, the random forest is actually worse, a rare occurrence in machine learning! (However, our test set is small, meaning measures of accuracy can change quite a bit based on 1-2 wrong/right predictions). When predicting on the test set, the model had an accuracy of only 51.72%, only slightly better than a random guess. Using the random forest, we correctly predicted 14 fastballs and only 1 offspeed pitch. There were 9 instances when we said the pitch would be fast when, in fact, it was an offspeed pitch. Additionally, there were five cases when we predicted offspeed when the pitch was fast.
One on the issues with the model is a class imbalance problem. Arrieta threw 79 “fast” pitches in the game compared to 40 offspeed. The models particularly struggle to predict offspeed pitches, likely in part because we simply aren’t giving it enough data to accurately learn. Or…it could be that Arrieta is just tricky!
In sum, neither the hitters, the decision tree, or the random forest could predict Arrieta during his perfect game! The failure of these simple models partially underscores the difficult challenge of anticipating the next pitch. Additionally, MLB hitters have heuristics they develop over time that machine learning models may never be able to capture.
Thanks for reading! We have many more exciting items to cover in upcoming blogs.
